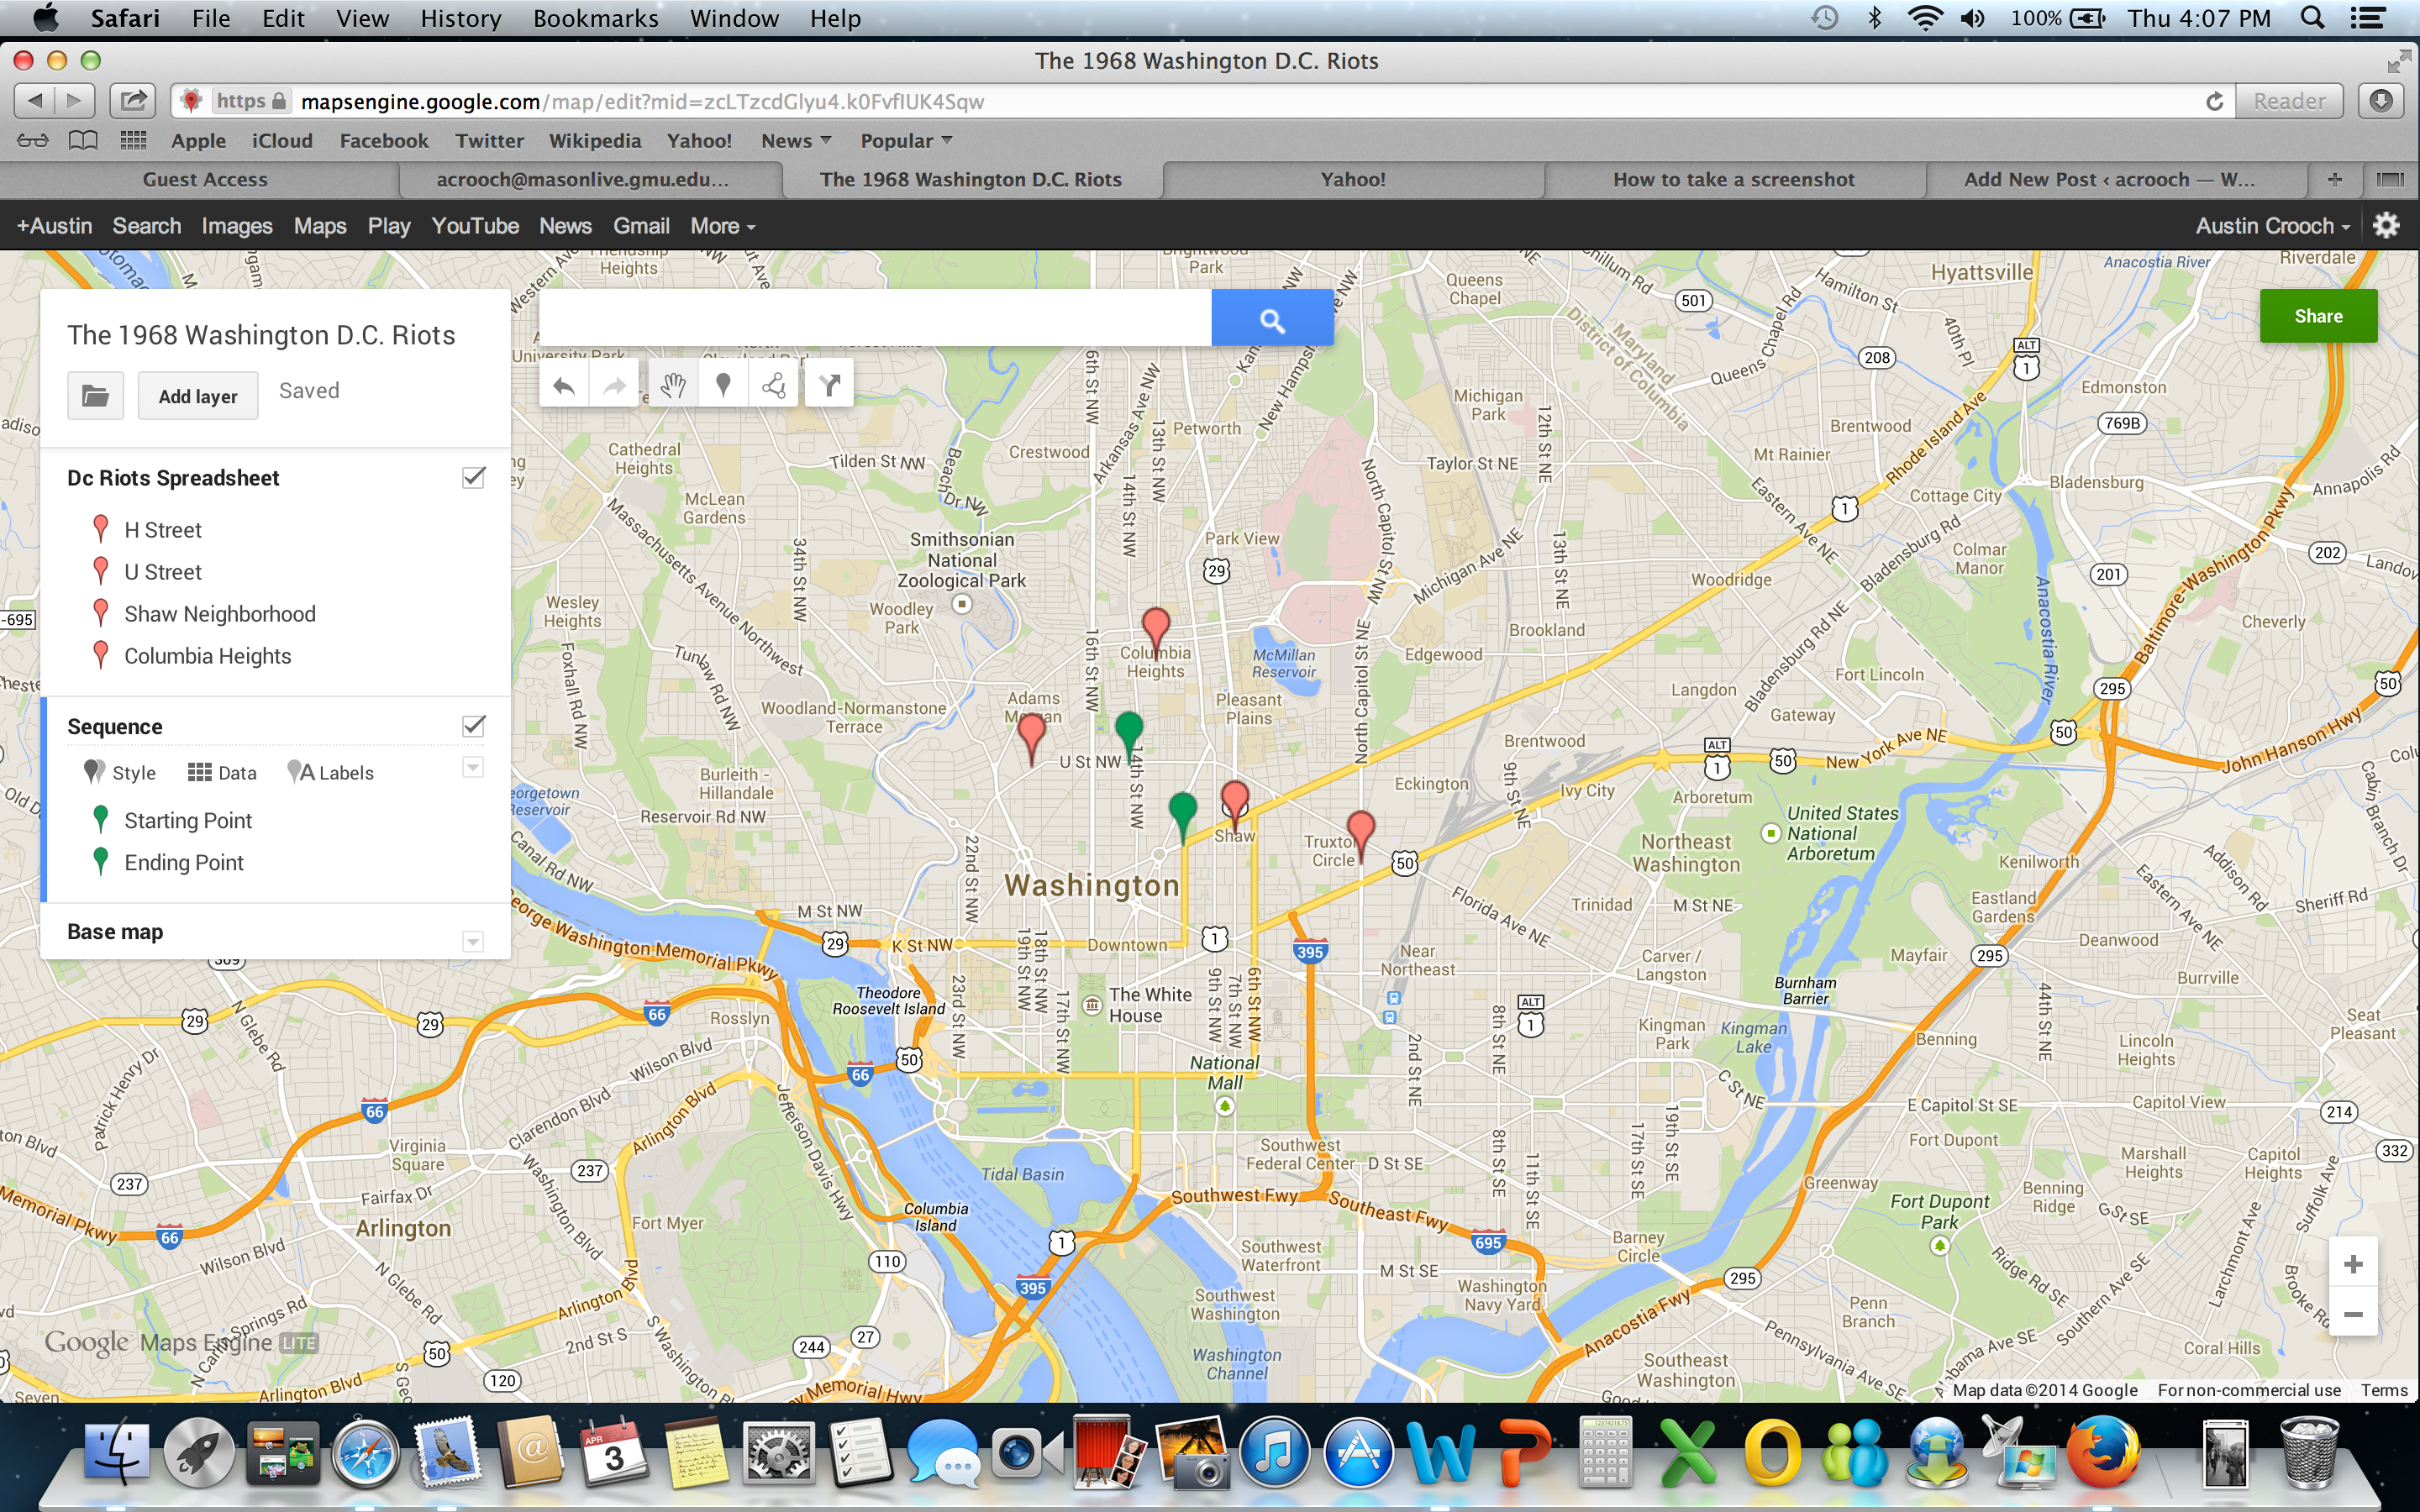
When designing my map, I chose just to do a general overview of the riots by pointing out the areas that were affected. In the first layer, I pinpointed all the neighborhoods that were involved and added a small informational bit with an historic image of the location. In the second layer, I only added points that showed where the riots began and ended. I did not draw any lines or shapes to connect the points because while there were clear spots where the riots started and finished, the riots occurred in several neighborhoods at once therefore any diagram would be confusing and unnecessary. I could not think anything else to do with the map; this topic can only can only be analyzed in map form by showing the places the event occurred in. There is nothing more that could be shown, except maybe adding the statistics of the damage in the description.
My map did not help me much in learning more about my topic because mapping is unlikely to provide information on how the neighborhoods were affected. The map can show the total area that was damaged but not much more. I can see what was affected but not how it was affected. It is hard to determine cause and effect relationships looking only at an online map.